


 18 / 36

Page 18
— Multifamily Properties Quarterly — November 2017
www.crej.comProfessional Management, Better Results
Full Service
Property Management
Providing award winning property management services
for over 30 years along Colorado’s Front Range
GBRents.com GriffisBlessing.com303.771.0800
5600 S. Quebec St, B141
Greenwood Village, CO 80111
719.520.1234
102 N Cascade Ave, Ste 550
Colorado Springs, CO 80903
• New Build
• Lease-Up
• Repositioning
• Rehabilitation
• Due Diligence
Valuation
A
persistent gripe in developer
circles is the constant upward
movement of construction
costs. This has been a sub-
stantial brake on the fast-
moving train of new construction
within the Denver market. Steadily
rising payroll and materials costs have
prevented new deals from penciling,
which has resulted in tightened purse
strings of construction lenders. More
and more proposed projects are being
left without financing, forcing devel-
opers to drop sites they have under
contract for acquisition. Don’t cry for
the down-trodden developer, though,
because there is more to this story
ahead.
These rising costs have made cash-
ing out of projects a lucrative pros-
pect for builders who brought their
projects to market. As costs have
risen over the past eight years in the
post-2009 doldrums,
we have seen the
per-unit cost metric
change dramati-
cally. The two tables
reflect “all-in” costs
of projects brought
to market over the
past 10 years. This
all-in cost is inclu-
sive of hard and
soft costs, as well
as land acquisition
costs. This cost does
not include a profit
incentive. The data
reflects the trends on over 50 com-
pleted or underway projects in the
Denver metropolitan statistical area.
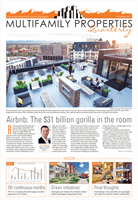
The dramatic shift shown in the
charts has moved the typical all-in
garden apartment construction costs
from a level of $135,000 to $150,000
per unit at the start of the cycle to
current projects in the $210,000 to
$240,000 per unit range. More dra-
matically, we have seen elevator-style
projects shift in cost from $180,000 to
$210,000 per unit to current projects
under way at costs north of $500,000
per unit. This leap in construction
costs has changed the value per unit
landscape of the market today.
As appraisers, we are armed with
the principle of substitution; we state
that a prudent buyer would pay no
more than construction cost new
today plus a profit incentive. However,
the concept of “cost new today” is
a moving target, steadily advancing
with the market. Next, we ponder the
more elusive topic of how much prof-
it? The answer to this question is hard
to extract. In our discussions with
market participants, we often hear a
range of 15 to 25 percent. But this will
only be borne out in an active market-
ing process, with buyers pitted against
one another to provide the highest
price to the seller.
This leads to a second area of
research: What profit have developers
actually been achieving? As costs have
inflated on the order of 10 percent
per year over the last several years,
we have costs today that are 20 to 30
percent higher than the costs actually
locked in by the developer at the proj-
ect’s origination. Adding this market
movement to “cost new today” sweet-
ens the pot for our developer friend
mentioned earlier.
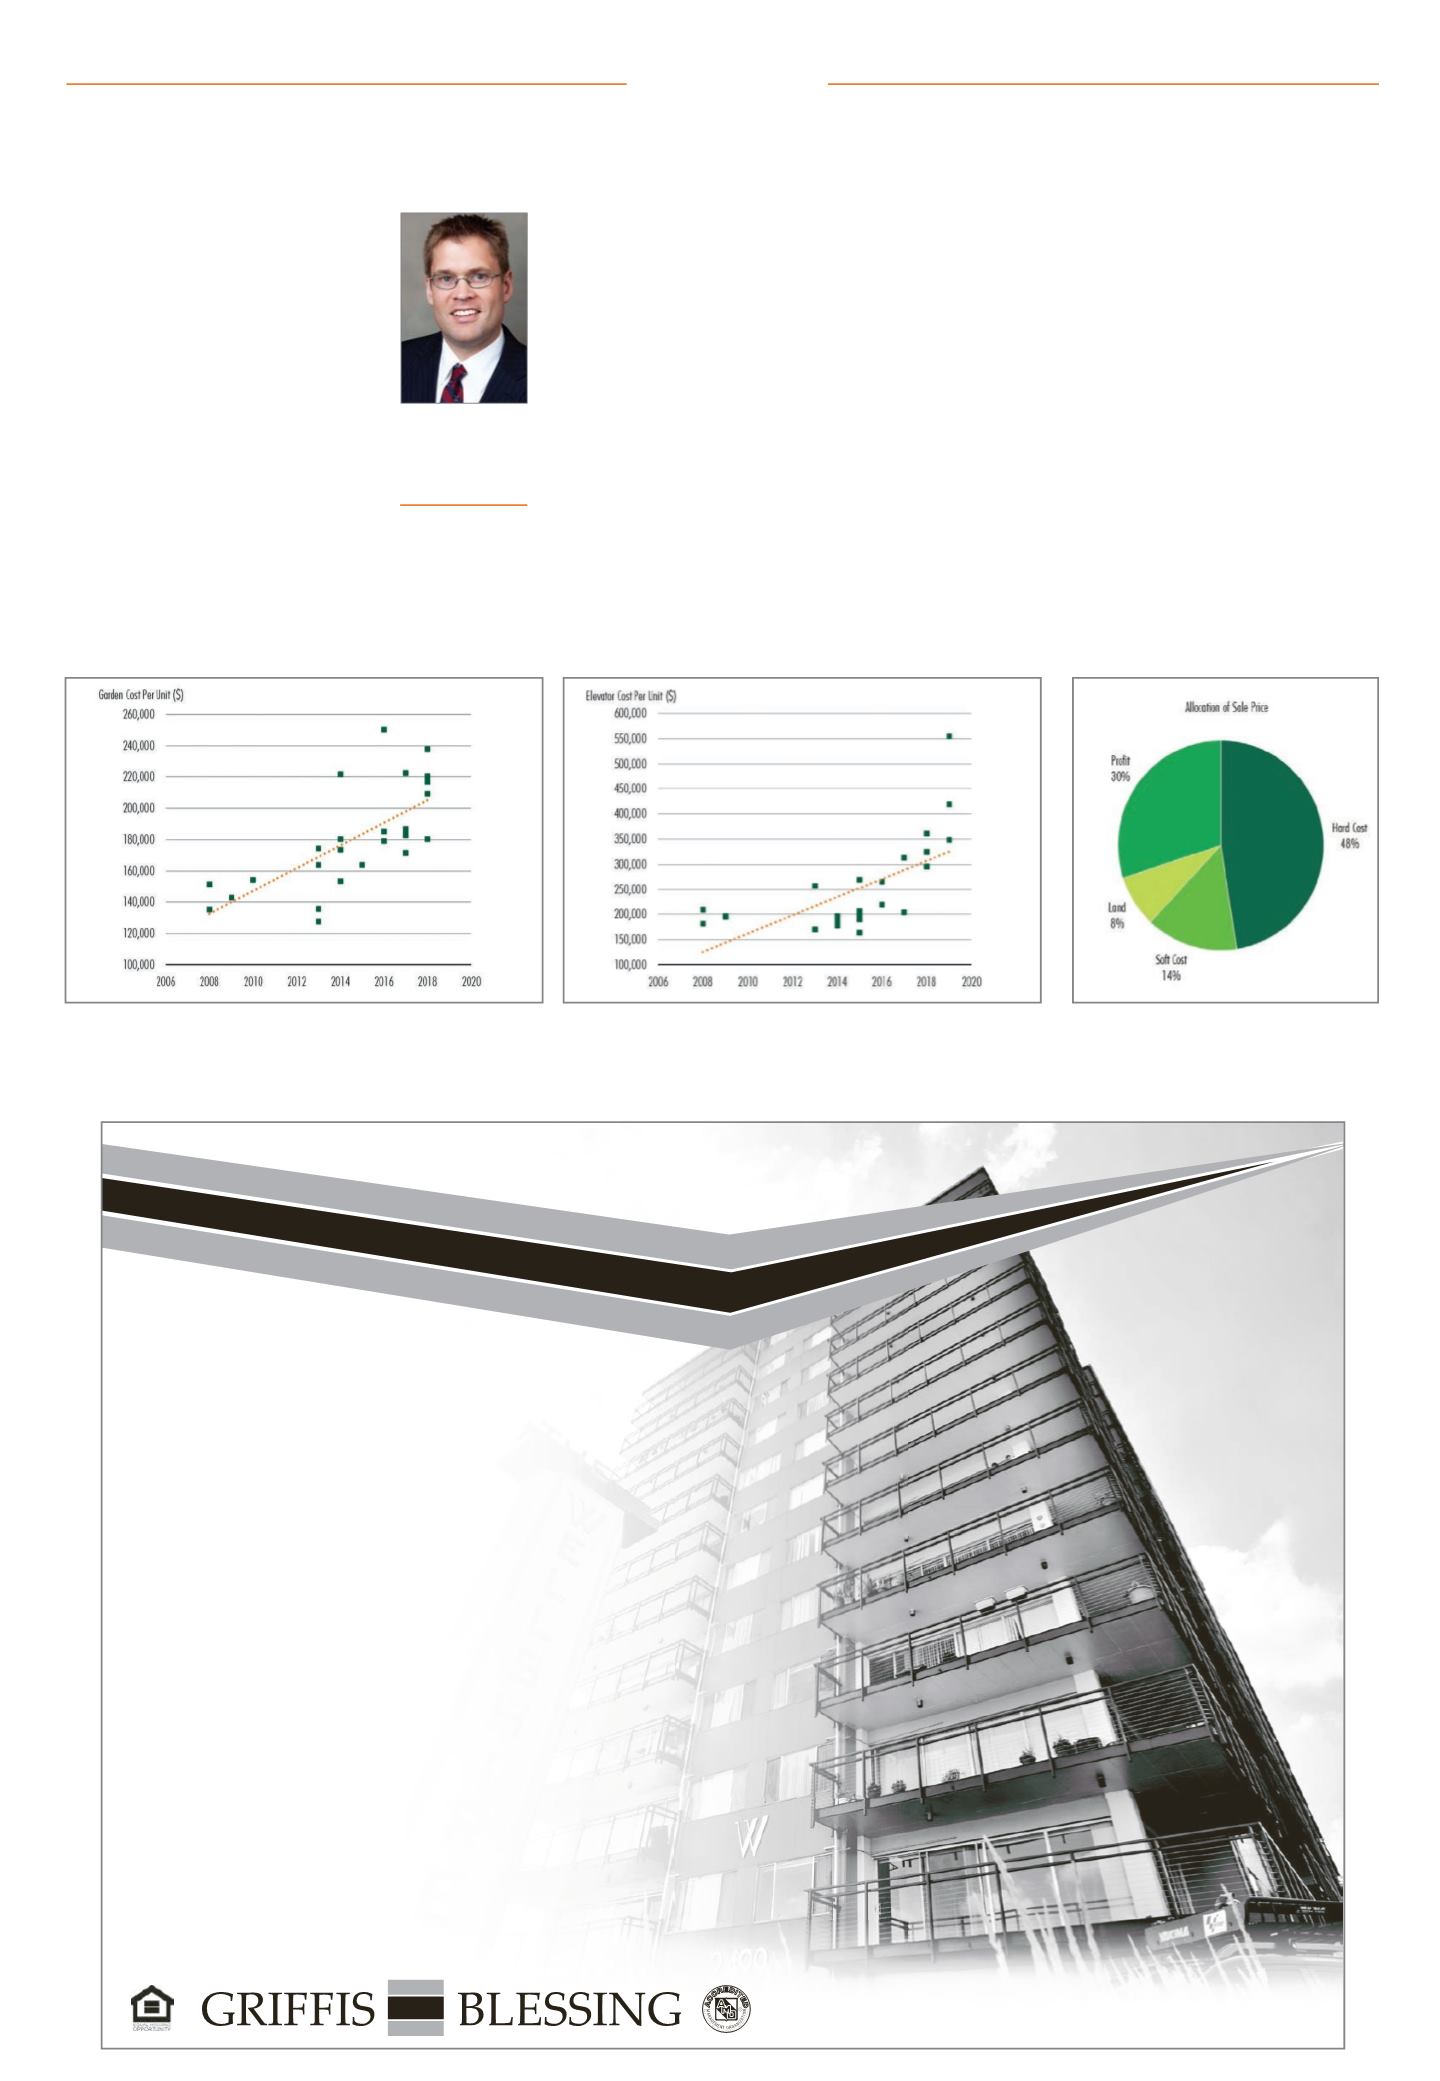
CBRE researched closed transactions
of new properties in the last several
years where construction costs were
known. This data leads us into the
pie-chart
graphic.Weaggregated the
Construction costs not diminishing profits, for nowMark Lodmill
Director, National
Multifamily
Valuation Group,
CBRE, Denver
CBRE
All-in costs of projects brought to market over the past 10 years. This cost is inclusive of hard and soft costs, as well as land acquisition costs, but
does not include a profit incentive. This data reflects the trends on over 50 completed projects and projects underway in Denver.
Please see Lodmill, Page 34CBRE
The chart shows where the average sale price
on a newly developed asset goes.