


 22 / 32

Page 22
— Office Properties Quarterly — January 2015
Design
“S
leeping giants” are not
fairy tale creatures or his-
toric architectural icons
like the Empire State
building in New York City
or the Wells Fargo Building in Denver.
Sleeping giants in corporate real estate
are the vast stock of older, more pro-
saic buildings domi-
nating our skylines.
Sleeping giants are
valuable building
assets that struggle
to compete as cities
change around them
and new buildings
enter their markets,
luring away prime
tenants.
What these build-
ings have in com-
mon, given their
age, is that they
were built before
a large number of
form-giving developments in building
technology were introduced. Before, for
example: Ethernet was standardized in
1983; cellular telephones were intro-
duced in 1984; the Internet backbone
was created in 1992; the U.S. Green
Building Council was established and
underfloor air systems were incorpo-
rated into signature projects in 1993;
and building automation systems
emerged around 2000.
These buildings were planned and
designed for a traditional idea of the
corporate office environment, well
before Richard Florida chronicled the
rise of the creative class of workers in
2002 and pop culture lambasted the
drudgery of high-walled cubicle envi-
ronments in movies like “Office Space”
and “The Incredibles,” not to mention
the ubiquitous Dilbert comic strip from
the mid-1990s.
These buildings have very little of the
amenity infrastructure to help them
compete with the redefined workspace
led by creative 21st century firms like
Google, which went public in 2004.
That same year, Google’s free-spirited
approach to workspace was widely
published and won numerous design
awards.
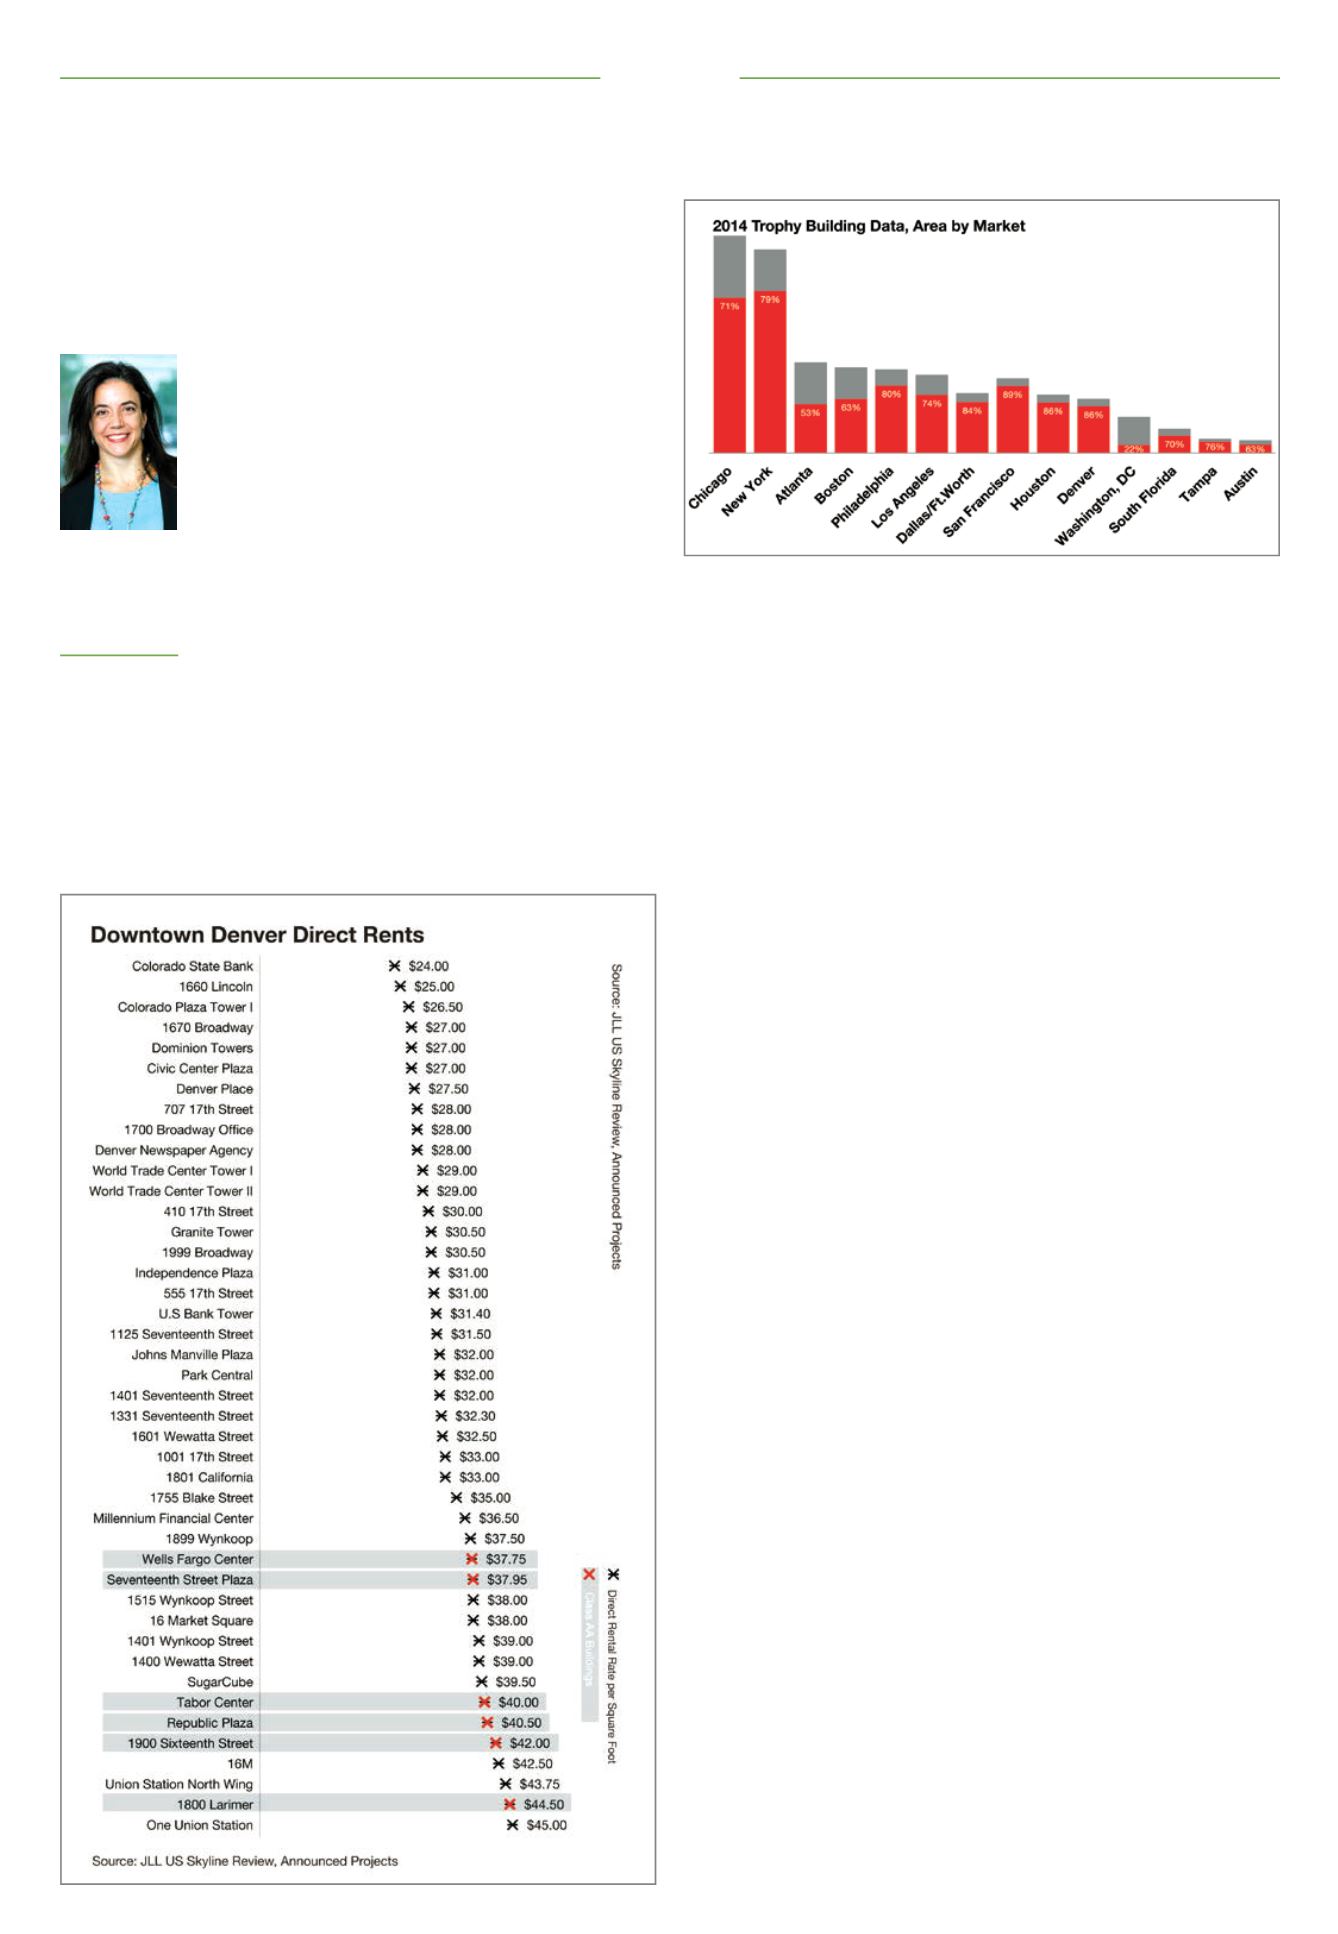
To illustrate the scale of aging asset
inventory across the country, we ana-
lyzed building data across 14 key U.S.
corporate real estate markets. We built
our analysis from JLL’s Spring 2014 US
Skyline Review. The buildings repre-
sent the top-quality urbanized office
micromarkets in each city. We graphed
today’s buildings by year completed
since 1950 to show that the vast
majority of our current multitenant
office buildings were in place by 1990,
which was 25 years ago. This building
landscape is familiar to us, we can see
it down many streets in Denver, and
this is the opportunity to reposition
assets facing our industry.
While new office tower construc-
tion is exciting, the bigger and more
enduring story lies in understanding
how the buildings in the background
must reposition themselves to remain
relevant. The bottom line is that aging
assets become candidates for repo-
sitioning when there is evidence that
investment will result in higher occu-
pancy, increased rental rates and a
positive return on the investment.
Asset Considerations
Key considerations for asset own-
ers contemplating repositioning their
aged assets are the current and desired
market position of the space, timing,
potential revenue and approach.
Market position in corporate real
estate is often described by class. In
Denver, there is a large inventory of
Class A buildings, with a small subset
identified as Class AA. When an owner
believes an asset has potential to per-
form like a Class A or AA property, but
knows that the asset is widely con-
sidered a Class B building by the local
market, improving that market percep-
tion of the building can be a primary
driver of a repositioning investment.
Timing is a crucial factor. First,
consider the duration the property
will be held and resulting window
for improved returns to materialize.
Some repositioning investments will
impact revenues more quickly than
others. Second, when new buildings
are coming on line that may compete
for desirable tenants, strategic repo-
sitioning projects can take advantage
of relatively short delivery cycles and
beat a ground-up construction project
to market. Finally, a major vacancy
can trigger repositioning, offering both
incentive to improve leaseability and
simplified construction.
Revenue concerns often trigger
repositioning. To justify the invest-
ment, asset owners must believe that
material increases in rental rates can
be achieved and the building will be
leased more quickly. Alternatively,
doing nothing may risk a reduction in
rental rates over time, and increased
difficulty leasing up vacant space. Yet
revenue forecasting models are limited.
Predicted return on any investment is
based upon best-guess assumptions
and may change as unanticipated fac-
tors impact market conditions.
Key to effective repositioning is to
take a fresh look at the property. Asset
insiders may find it difficult to imag-
ine all the viable possibilities. A design
competition can be a great tool to
solicit ideas before finalizing the proj-
ect scope and selecting a design team.
Offering payment helps to ensure that
design firms will dedicate their best
resources, and setting up the competi-
tion brief with minimal guidance from
the owner can free designers to gener-
ate unexpected visions for the project.
Releasing Value
Through experience across numer-
ous repositioning projects, we have
identified 10 key approaches to pin-
point and unlock trapped asset value.
1. Ask local experts –
People most
familiar with the building are a great
resource for ideas and possibilities.
Beyond the owners, leasing agents,
property managers and facilities team,
we find it beneficial to reach out to
people in the market such as brokers
and tenants who interact with the
property from the outside and offer a
broader view of prospective tenant per-
ception and market demand.
2. Quantify anecdotal trends –
Follow
up on informal conversations by quan-
tifying relevant trends in your market.
One approach is to compare develop-
ment activity on a timeline to highlight
relationships and illustrate dynamics
unique to your market. Tracking the
changes in downtown Denver over
time highlights the role of residential
development. Hotel room availability
has grown dramatically over the last
decade, but the number of residential
units downtown has been growing
steadily since the early 1990s. While
almost half the inventory of multiten-
ant office space in Denver was built by
1985, unlike many cities that are only
now seeing growth from that base,
the Denver market has steadily added
office properties since 2005.
3. Investigate market dynamics –
Com-
petitive data is available from numer-
ous sources and can be used to under-
stand what the key competitive drivers
are in a particular market and identify
assets that may be poised for reposi-
tioning. Plotting the trophy buildings in
downtown Denver on a graph sorted by
direct rents shows a fairly large spread
in Class A rents across the market
(from about $24-$45 per sf). Surpris-
ingly, the properties identified as Class
AA do not command the highest rents
in the market.
This observation invites a closer look
at market competitiveness. A quick
re-sort to separate the buildings by
location within downtown adds clarity.
Grouped first by location, then sorted
by rent, the Class AA buildings rise to
the top in the core commercial area
group. While buildings are much larger
and the scale of building inventory
is far greater in the core commercial
area, the average direct rent for the
Lower Downtown/Central Platte Valley
buildings (about $38) is greater than
Sleeping giants and aging assets are everywhereJamie Flatt
Associate
principal, Page.
Page has offices
throughout the
country, including
Denver.
Seventy percent or more of the 2014 trophy-building stock in 10 of the 14 markets
was in place by 1989.
Existing Class A multitenant buildings, sorted from least to greatest rents