


 12 / 40

Page 12
— Multifamily Properties Quarterly — August 2017
www.crej.comDenver Highlight
A
s a Denver native, I know
firsthand howmuch our city
has changed. I used to live
southeast of Parker and Arapa-
hoe roads, which was pretty
much in the middle of nowhere.The
only retail at that intersection was the
Barn Store and a gas and convenience
store, which was where I used to ride
my bike to play Donkey Kong and get
an Icee on a hot day.Today, that inter-
section is home to several major retail
centers and luxury apartments.
The population of Colorado has more
than doubled since my childhood, and
with the influx of new residents and
businesses, the cost of renting has gone
up. Some of our clients have been ask-
ing whether Denver has become too
expensive relative to Colorado/Denver
wages.Wedid some research to find
out just how expensive it is to live in
Denver and howwe compare to other
markets.
Rent vs. Income
•
How much rent can you afford?
Apartment management companies
often qualify residents on a ratio of
their gross monthly income before
taxes to their rent. A common ratio we
hear frommanagement companies
is three times the rent to qualify. For
example, a person making $36,000 a
year, or $3,000 per month, would qual-
ify for $1,000 per month at three times
his rent.The equation would be $3,000
(monthly income) ÷ 3 (qualifying ratio)
= $1,000 maximummonthly rent.
•
Percentage of income spent on rent.
Another way of looking at affordability
is the percentage of a household’s gross
income (annually or monthly) that is
spent on rent. In the
example above, a
person paying $1,000
per month in rent
would be paying
33.3 percent of her
income toward rent.
The equation would
be $1,000 (monthly
rent) ÷ $3,000
(monthly income) =
33 percent (income
spent on rent).
According to the
Bureau of Economic
Analysis, Denver has
a median household
income of just over
$70,000. According to
Apartment Insights, the average metro
rent at the end of the second quarter
was $1,399 per month. If we annualize
the monthly rent to $16,788 and divide
by the annual income, on average,
households in the metro area are pay-
ing about 24 percent of their income
on rent: $16,788 (annual rent) ÷ $70,000
(median household income) = 24 per-
cent of income spent on rent.
In an effort to take a narrower view of
the data, we looked at one of Denver’s
least expensive submarkets, northeast
Aurora, which had an average rent of
$1,039 per month at the end of the
second quarter, according to Apart-
ment
Insights.Wepicked roughly the
center of this statistical submarket and
pulled a 3-mile radius demographic
report, resulting in a $41,000 median
household income. Again, if we take
the annual rent divided by the median
household income, residents in this
submarket pay, on average, 30 percent
of their income on rent: $12,468
(annual rent) ÷ $41,000 (median
household income) = 30 percent of
income spent on rent.
In contrast to household median
incomes, a single person earn-
ing minimum wage of $9.30 per
hour, or $19,344 a year (assuming
40-hour workweeks and 52 weeks
of full-time employment), would be
hard pressed to find an option to
live alone. Using a three times rent
qualifying ratio, a full-time, mini-
mum-wage earner could only afford a
monthly rent of $537: $1,612 (monthly
income) ÷ 3 (qualifying ratio) = $537
(maximummonthly rent).
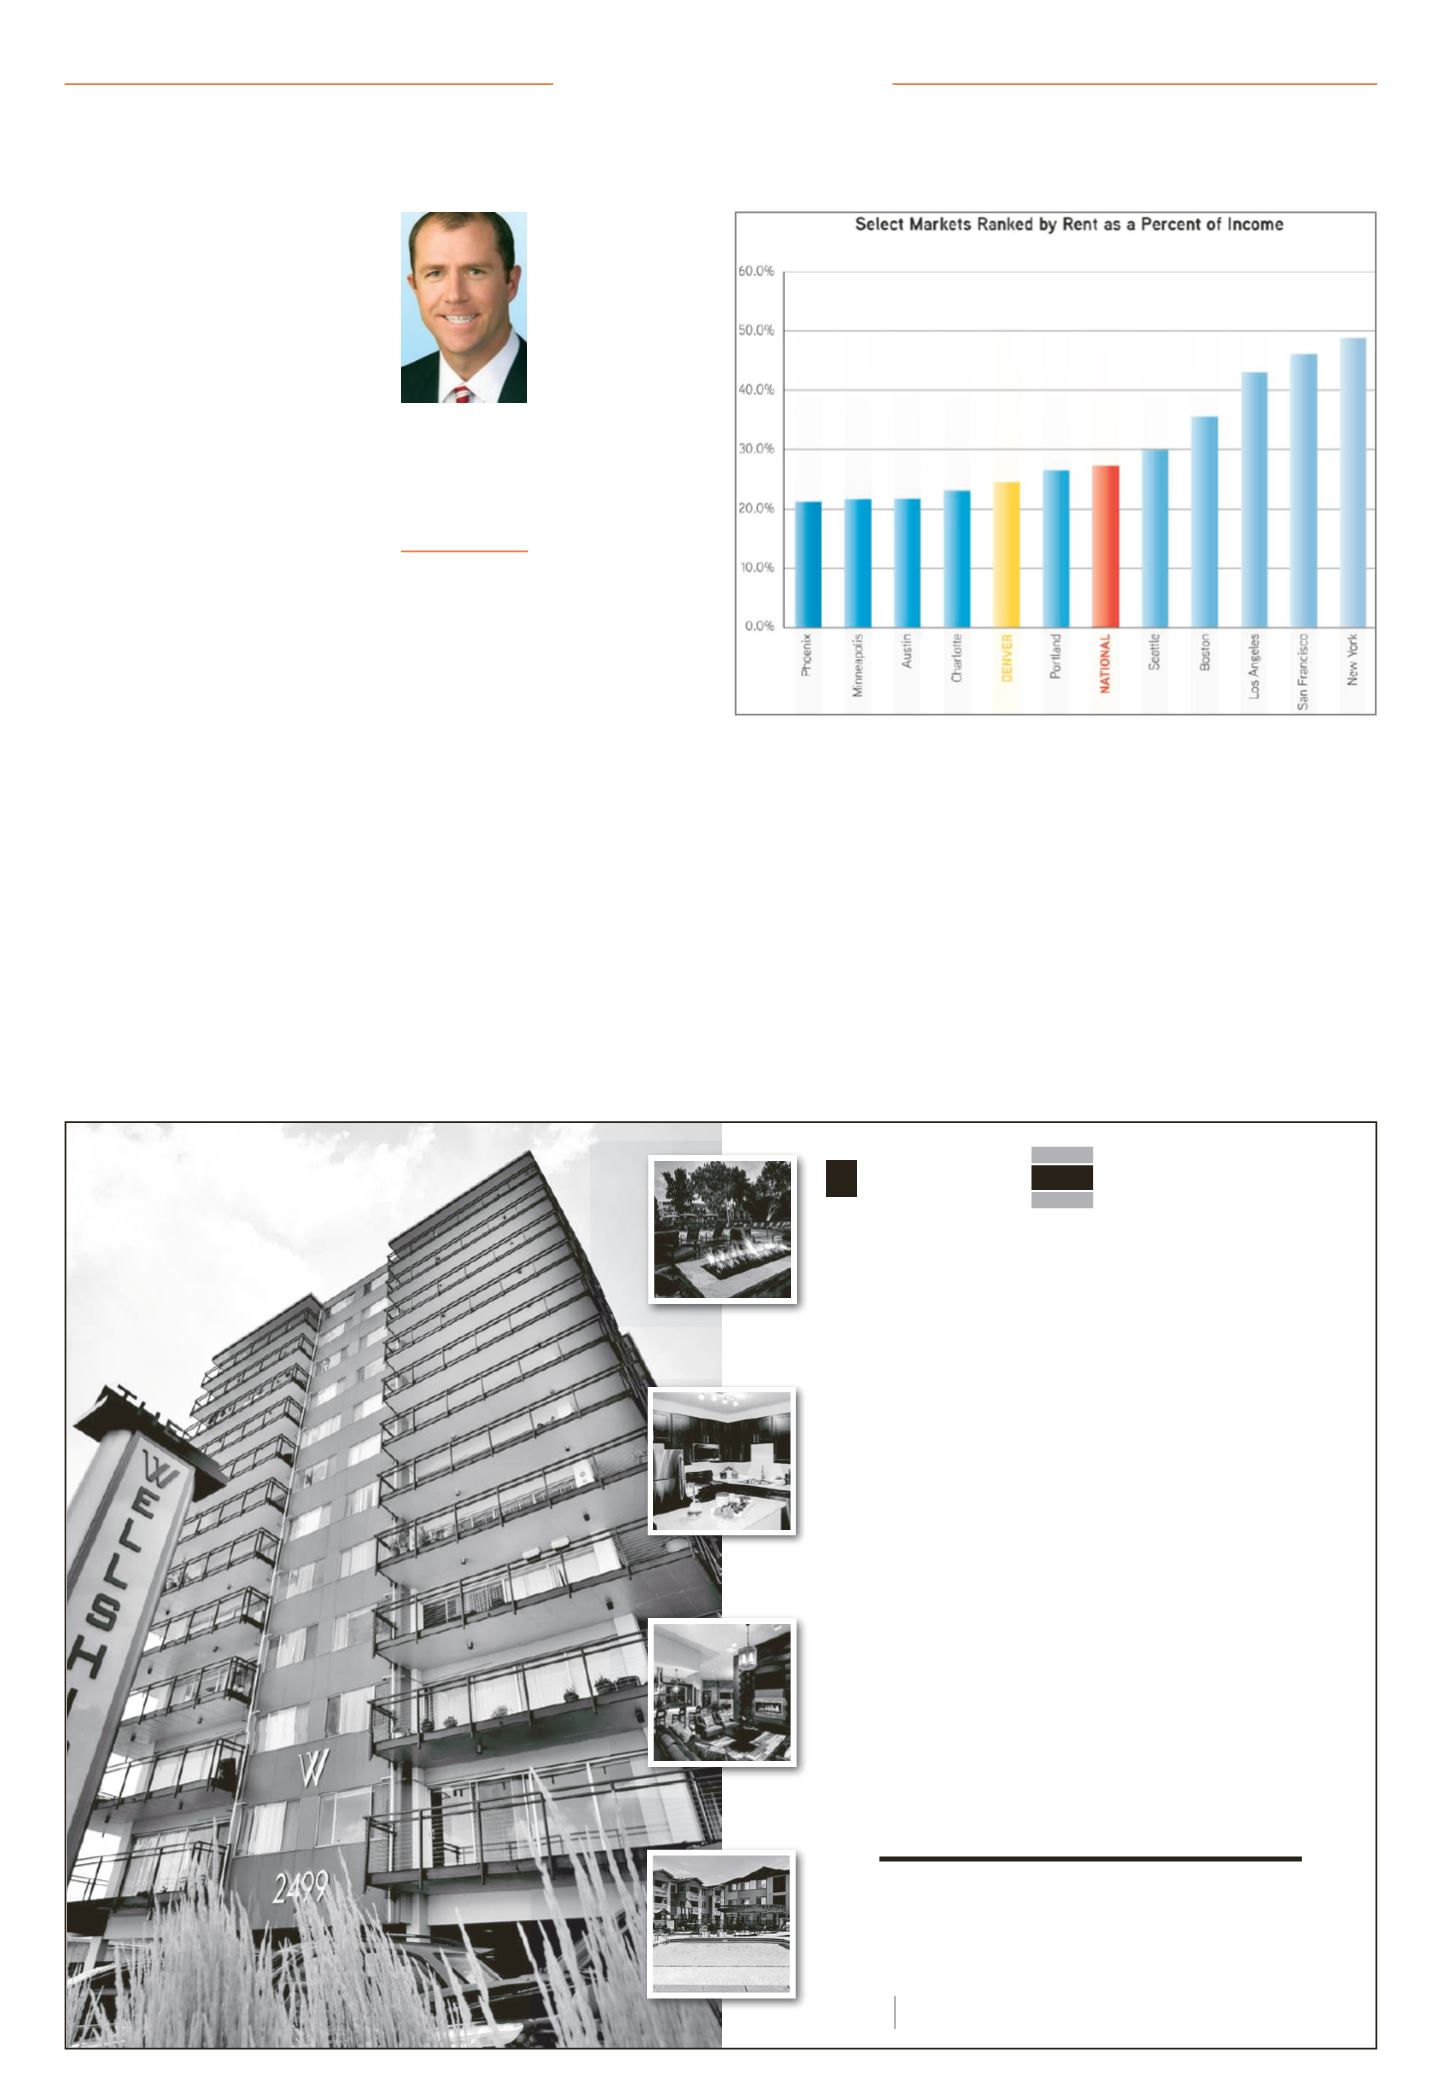
HowDoes Denver Compare?
Using household median income
data from the Bureau of Economic
Analysis and average metro rents
How do Denver wages compare to Denver rents?GRIFFIS BLESSING
Full Service Property Management
Construction Services
Due Diligence
Receivership
Financial Services
www.GriffisBlessing.com102 N. Cascade Ave. Ste 550,
Colorado Springs, CO 80903
(719) 520-1234
Come find out
what makes
Griffis/Blessing Different!
5600 S. Quebec St, Ste B141,
Greenwood Village, CO 80111
(303) 771-0800
Craig Stack
Senior vice
president,
multifamily
investments,
Colliers
International,
Denver
Please see 'Stack,' Page 36Colliers International
Using household median income data from the Bureau of Economic Analysis and average
metro rents provided by Axiometrics, the chart compares the percentage of income spent
on rent across several major markets.