


 8 / 24

Page 8
— Health Care Properties Quarterly — January 2018
www.crej.comMarket Update
A look at recent numbers defining the metro Denver and national medical office building market
H1 2017
CBRE Research
© 2017 CBRE, Inc. | 1
MARKETVIEW
Vacancy Rate
9.4%
Under Construction
226,600 sq. ft.
Completions
128,351 sq. ft.
Net Absorption
137,063 sq. ft.
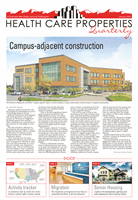
Denver’s medical office building (MOB) market
experienced solid fundamentals in the first half
of 2017 due to strong demand for quality space
and favorable demographic trends. Positive net
absorption of 137,063 sq. . was achieved in H1
2017. The direct vacancy rate decreased to 9.4%
versus 10.3% a year ago, and the overall
availability rate remained stable at 12.2%. The
average direct asking lease rate was $28.04 per sq.
. full service gross (FSG), an increase of 2.7%
year-over-year. Investment sales activity increased
by 87.6% year-over-year, with transaction volume
reaching $72.8 million through H1 2017.
25
26
27
28
8
9
10
11
Q2 2016
Q3 2016
Q4 2016
Q1 2017
Q2 2017
Direct Vacancy Rate (%)
Direct Average
Lease Rate
Per Sq. Ft. ($)
Direct Vacancy Rate
Direct Average Lease Rate
Source: CBRE Research, Q2 2017.
*Arrows indicate change from previous half year.
• Direct vacancy decreased to 9.4% in Q2 2017,
down 96 bps year-over-year.
• Year-to-date net absorption totaled 137,063
sq. ft. in H1 2017, which helped bring down
the overall vacancy rate to 9.4%.
• Availability of 12.2% decreased 57 bps from
the previous six-month period.
• In H1 2017, 128,351 sq. ft. of medical ofce
space was completed in ve buildings with 74%
of the space preleased.
Figure 1: Vacancy Rate vs. Lease Rate
Lease Rate
$28.04 FSG
Denver Medical Ofce, H1 2017
Medical ofce remains an
attractive niche