Page 4
— Retail Properties Quarterly — November 2015
H
ow aggressive is pricing for
net-lease investments right
now? Very aggressive based
on what is observable in
recent transactions. Net-lease
investment properties have become a
popular investment vehicle for small-
er investors seeking a fixed return
with few responsibilities for a land-
lord. Retail net-lease assets typically
are single-tenant properties that are
leased for long-term to a well-estab-
lished or widely recognized retail or
service concept.
Common examples include banks,
restaurants, drug stores, coffee shops,
gas stations, automotive parts stores,
discount stores, learning centers and
specialized facilities, such as day care
facilities or automotive service sta-
tions. Here are some common terms
that typically are found in a lease that
is structured for a net-lease invest-
ment sale:
• Single tenant (often a regional or
national branded concept)
• Long-term lease (10 to 20 years)
• Fixed lease rate with structured
increases
• Tenant is responsible for taxes,
insurance and all maintenance (tri-
ple-net lease)
Do these terms remind you of
another type of investment? Perhaps
a corporate bond? These types of
investments do have a lot in common
– aside from relative liquidity – and
market returns for both options tend
to exhibit a similar risk-and-reward
relationship.
Let’s consider two hypothetical
retail assets that are located in the
same shopping center. The first asset
is a conventional retail building that
is leased for a
10-year term to a
coffee chain that is
operated by a $10
billion company
with an investment-
grade credit rating
and a brand that is
recognized around
the globe. The sec-
ond asset is also a
freestanding retail
building that is
leased for a 10-year
term; however, the
lessee has made
some questionable
financial decisions over the past sev-
eral years and he now has a higher-
risk credit rating. The building also
features several unique design ele-
ments and an unconventional layout.
In the event that the tenant vacates,
it is probably going to be a difficult
property to re-lease. Obviously, inves-
tors will need a much higher return
on investment for the second asset,
which has a higher-risk profile.
To gauge current market pricing,
this article will examine and sum-
marize investment activity over the
past 12 months along with a few
current listings for good measure. To
peg current investor demand, we will
examine implied capitalization rates
from these transactions. As a remind-
er, a capitalization rate is the ratio
between net income and the sales
price or market value of an asset. To
avoid skewing the results of this sur-
vey, the market data set is limited to
stabilized performing assets where
confirmation of transaction details
could be attained.
To get a more specific set of market
pricing indicators we will split the
sales data into two categories. The
two categories will be based on the
credit rating of the lessee. Category
one will be limited to assets with
tenants that are rated as investment-
grade status by one of the major
credit ratings agencies. Category two
is limited to assets with tenants that
have credit ratings below the invest-
ment-grade tier or tenants that are
not rated, including local or regional
business concepts.
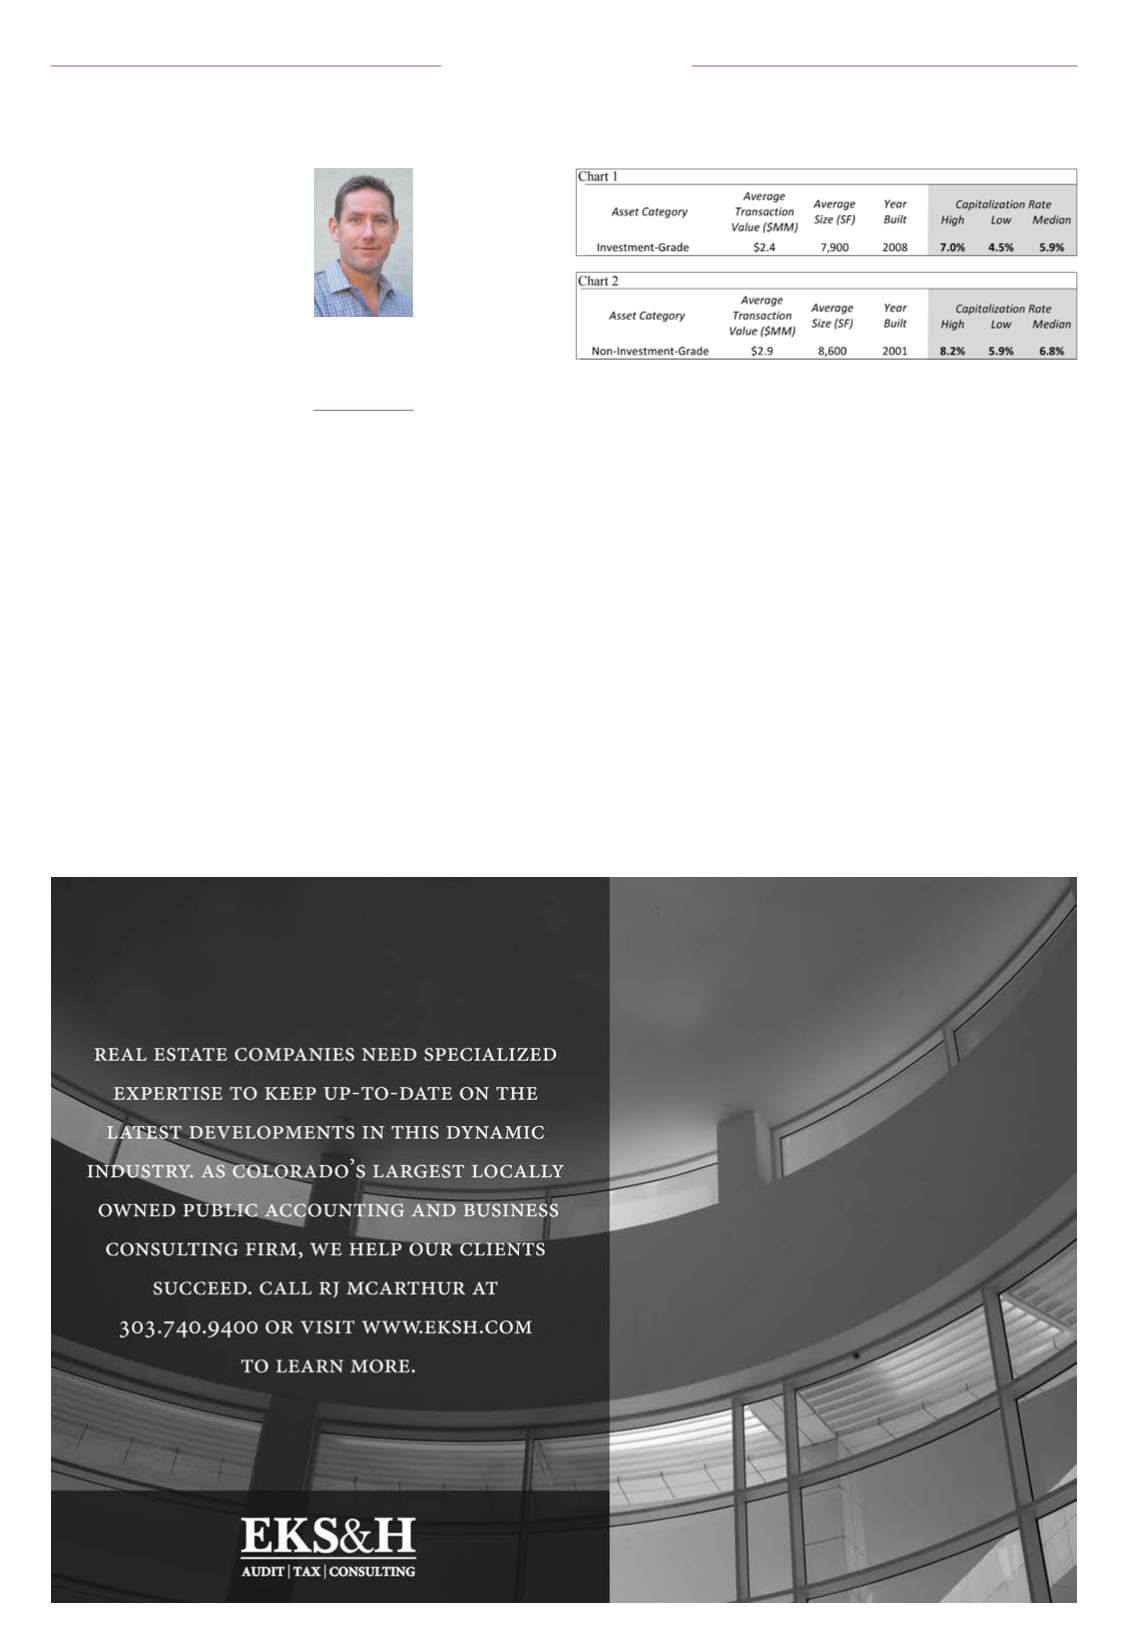
With the asset categories clearly
established, Chart 1 shows the
implied capitalization rates for the
investment-grade asset category
along with some key characteristics.
Note that the following characteristics
were identified with lower implied
capitalization rates:
• Higher-quality credit rating
• Conventional retail box that would
appeal to many potential users
• 10 years or more of remaining
lease term
• Located within a well-established
shopping center
• Evidence of strong tenant sales
activity
Chart 2 shows the implied capital-
ization rates for the noninvestment-
grade asset category. In looking at this
set of transactions we found that the
key characteristics identified with
lower implied capitalization rates
were identical to those identified in
the investment-grade data set.
We compared results from the
Denver market to sales occurring
nationwide and found rates of return
to be highly similar. Broker feedback
and market transaction data suggest
that demand remains exceptionally
strong; however, there is some evi-
dence that capitalization rates are
stabilizing.
Investors remain concerned about
interest rates, and they are watching
trends; however, near-term demand
is not impacted by investor concerns
for rate movement at this time.
There simply aren’t enough alterna-
tive investment options available for
investor demand, especially for inves-
tors who may have time constraints
resulting from a 1031 exchange.
s
Reagan
Hardwick
Vice president,
National Valuation
Consultants Inc.,
Denver
Market Update


