


 27 / 32

April 2015 — Office Properties Quarterly —
Page 27
Development
T
he Southwest Energy Effi-
ciency Project recently pub-
lished a set of fact sheets
that examine commercial
construction activity in the
Southwest. As a whole, the six-state
region has a relatively low popula-
tion of about 20 million, yet in 2013
investors poured $11.3 billion into
commercial construction projects.
Wyoming, Colora-
do and Utah expe-
rienced the biggest
increases in com-
mercial construc-
tion projects in the
region. In 2013, the
total value of all
commercial con-
struction projects
in Colorado was
about $3.2 billion.
Looking spe-
cifically at office
projects in the
private sector, the
total value of all
new construction and renovation
projects in Colorado was just over
$220 million in 2013. Note that, in
the CMD database, office buildings
do not include medical, military or
warehouse offices. When govern-
mental offices are included in the
calculation, the total value of all
new construction and renovation
projects in the state was over $342
million for the same year.
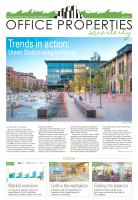
In the private sector, the propor-
tion of renovation projects to new
construction projects has grown
since 2009, but new construction
projects still account for the bulk of
total project value. This means that
the total number of office renova-
tion projects is increasing, but proj-
ect costs are much higher for new
construction projects because they
comprised 90 percent of the total
private project costs in 2013. When
public-sector office buildings are
included, the proportion of renova-
tion projects increases significantly
in all years from 2006 to 2013, and
most significantly from 2009 to 2013
(renovations make up 86 to 92 per-
cent of projects in these years). In
fact, 92 percent of all office projects
constructed in 2013 were renova-
tions when governmental offices
are included.
In terms of cost, new construction
projects comprised about 68 per-
cent of the total office construction
value in 2013 when governmental
offices are factored into the analy-
sis. In this case, renovations are
driving the market more so than in
the private sector.
The CMD data also classifies com-
mercial projects by county so that
trends in construction by geograph-
ic area can be evaluated. This begs
the question: Where in Colorado is
the most office building construc-
tion occurring?
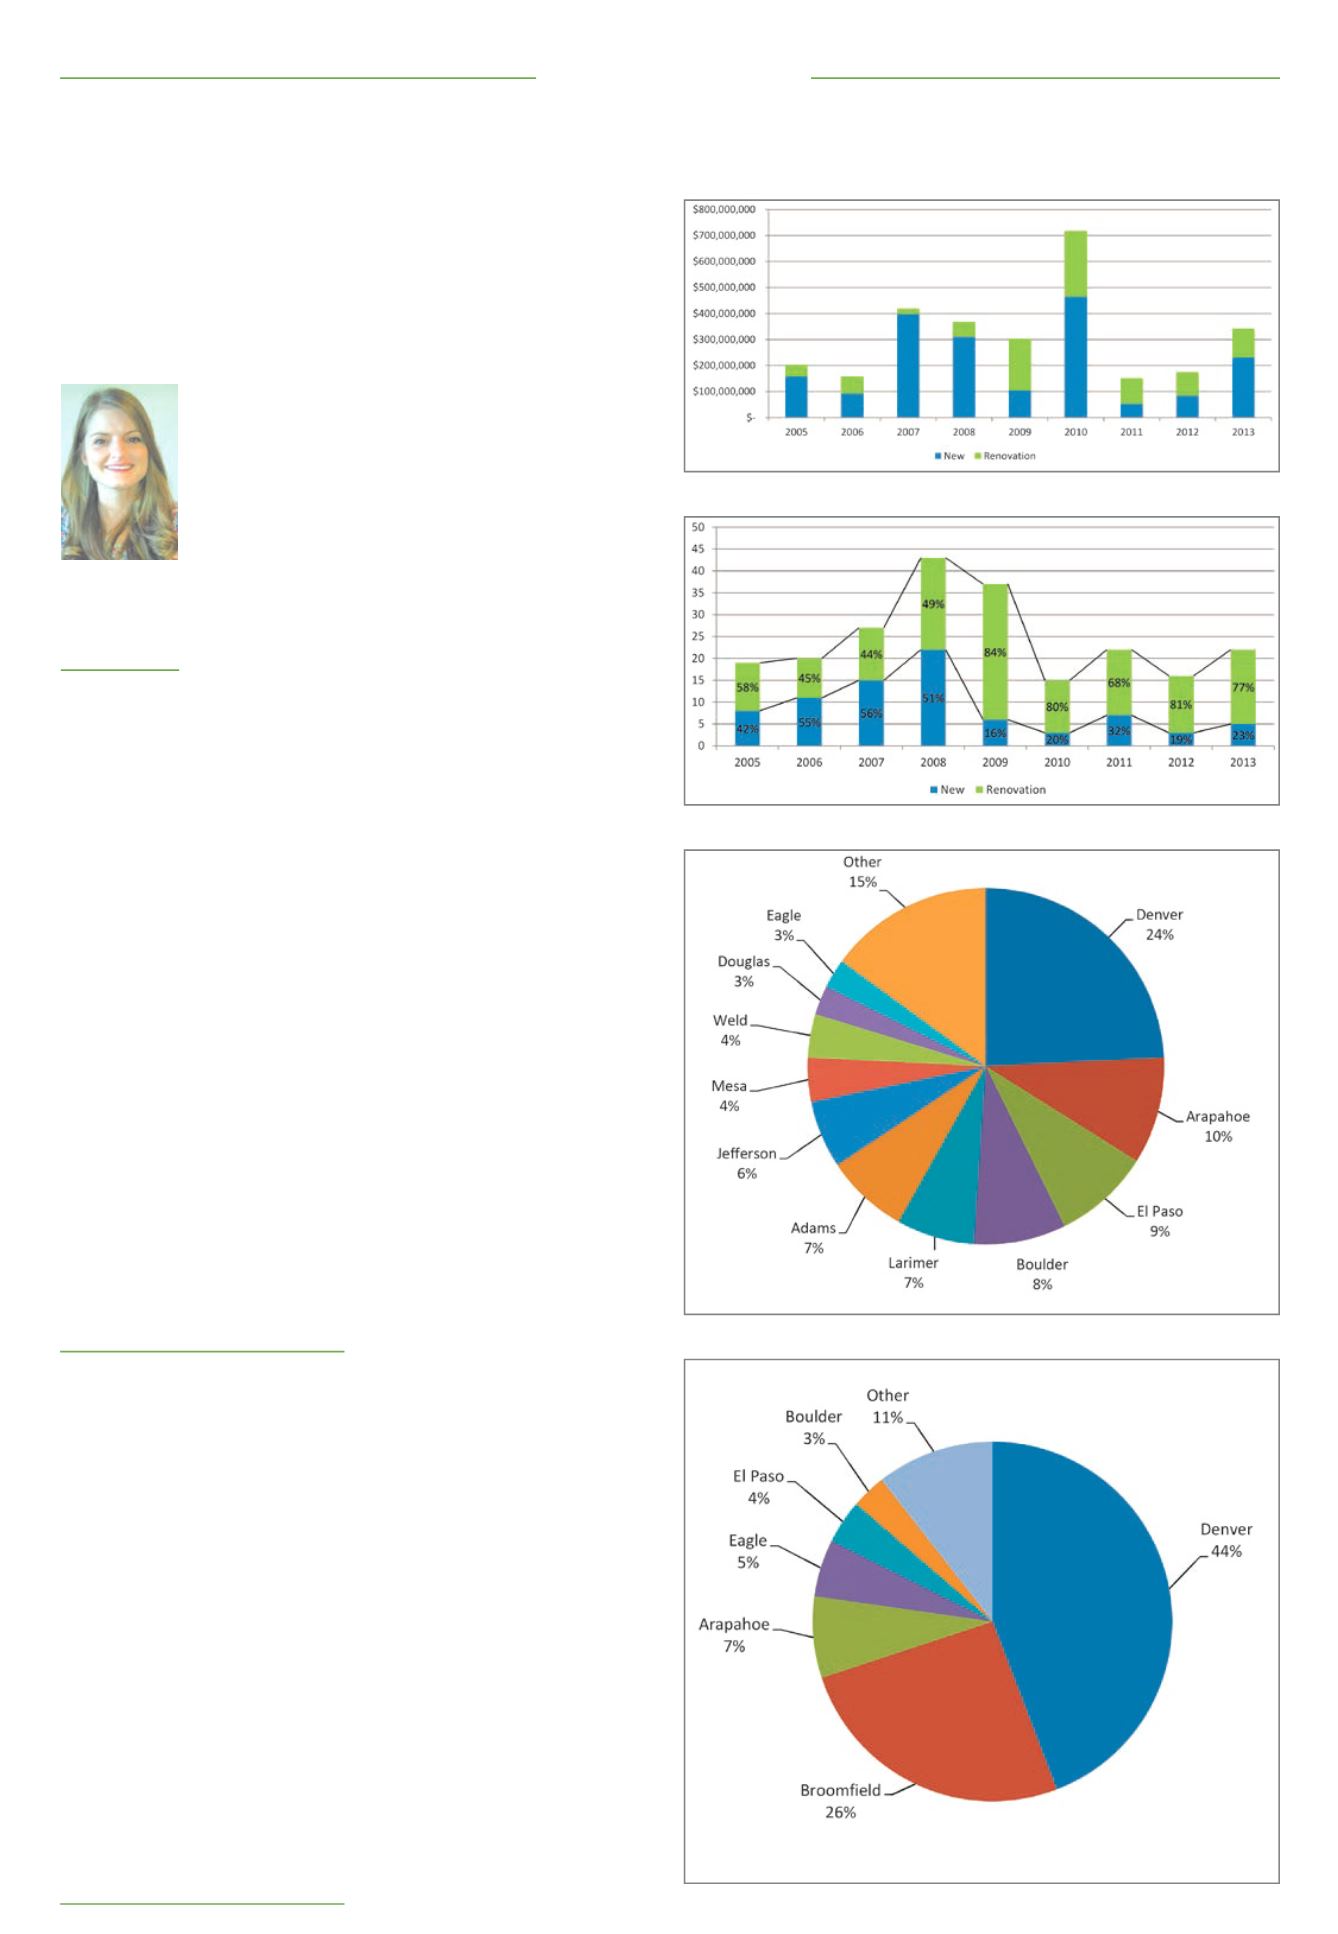
Well, that depends on how you
look at it. Regarding the number
of project starts or the total num-
ber of projects, the top counties in
descending order are: Denver (24
percent), Arapahoe (10 percent),
El Paso (9 percent), Boulder (8 per-
cent) and Larimer (7 percent). This
means that more office projects are
constructed in these counties than
other counties in the state.
Regarding the total sf constructed,
the top counties in descending
order are: Denver (44 percent),
Broomfield (26 percent), Arapahoe
(7 percent), Eagle (5 percent) and El
Paso (4 percent). This means that
more office space is constructed in
these counties than other counties
in the state. These statistics were
generated using years 2005 to 2013,
and square footage estimates are
available for new construction proj-
ects only.
Overwhelmingly, and perhaps not
surprisingly considering its popu-
lation, Denver surpasses all of the
other counties in Colorado when it
comes to office building construc-
tion. This is also true by total proj-
ect cost for years 2005 to 2013, dur-
ing which Denver represents about
52 percent of the total project value
in the state for office buildings.
There is not considerable vari-
ance in the top counties for office
construction when governmental
offices are included, except that Jef-
ferson County (and not Arapahoe
County) is in the top five counties
for number of projects, and Boulder
County (and not Eagle County) is in
the top five counties for total proj-
ect value or cost.
As to private office building size,
the trend in Colorado is similar to
that of the region. There is a high
number of small office projects
being constructed, but the largest
office buildings comprise a high
percentage of total sf constructed.
Almost half of the private sector
office projects in Colorado are less
than 25,000 sf (41 percent), but
buildings in the 500,000 sf to 1 mil-
lion sf range represent the largest
portion of total sf. These statistics
were generated using years 2005 to
2013, and sf estimates are available
for new construction projects only.
In summary, 2013 showed:
• An increase in total project value
when looking at office construction
(new construction and renovations);
• A high percentage of office proj-
ects are renovations, especially in
the public sector;
• Denver is the top county in
Colorado for office building con-
struction, and Broomfield office
buildings account for a considerable
percentage of office building con-
struction in terms of sf;
• Most office buildings construct-
ed are 250,000 sf or less (86 per-
cent); and
• The largest buildings of 250,000
sf or more comprise about 70 per-
cent of the total sf constructed from
2005 to 2013.
s
A look at Colorado’s robust office constructionLauren Smith,
LEED AP BD+C
Program associate,
Southwest Energy
Efficiency Project,
Denver
Total office project cost by year (private and public sectors)
Number of office projects by year (private sector)
Top counties by number of projects (2005-2013)
Office building size in square feet by number of projects
This means that the
total number of office
renovation projects
is increasing, but
project costs are
much higher for new
construction projects
because they
comprised 90 percent
of the total private
project costs in 2013.