


 11 / 32

January 2015 — Office Properties Quarterly —
Page 11
Central Business District
O
ver the years, many cities
have seen shifts to their cen-
tral business districts, espe-
cially in regard to the area
known as the “100 percent
location.” This location is also known
as the 50-yard line or Main and
Main.
Denver’s office CBD has shifted
over the last 30 years. The traditional
100 percent location generally was
thought of as Denver’s city center
location at 17th and California streets.
The majority of the office building
inventory in this location was con-
structed during the late 1970s and
early 1980s. In the mid-1980s, the
100 percent location shifted west
to 17th Street and Lawrence Street
after the completion of 17th Street
Plaza and the Tabor Center complex.
The addition of the baseball stadium
brought numerous restaurants and
entertainment facilities. Tenants want-
ing to attract younger employees
decided to push further west to this
area and many office buildings were
constructed in the late 1990s through
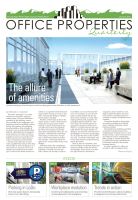
today. The red outline on the map
indicates the shifted 100 percent loca-
tion, while the blue outline represents
the old location.
When the Denver Union Station
redevelopment was announced in the
early 2000s, more development was
proposed both adjacent to and behind
the station. These buildings typically
were LEED-certified, state-of-the-art
properties. In the Denver CBD, the
revitalization of Union Station had a
dramatic impact on the movement
of the 100 percent location. In return,
many developers and investors con-
structed new product in and around
Union Station.
A few pioneering developers were
early to the party and invested in this
area, because they understood that
upon renovation completion, the area
would be attractive to tenants. This
foresight paid off. Denver Union Sta-
tion re-opened this year as a multi-
modal transportation hub offering new
restaurants, nightlife, office space and
a boutique hotel.
Further, with easy access to light
rail, train and bus transportation, ten-
ants, visitors and business custom-
ers can quickly access Union Station.
When the east rail line is completed
in 2016, it will provide direct access to
Denver International Airport. This area
captured record-setting office sales,
low vacancy and some of the highest
rental rates in the marketplace.
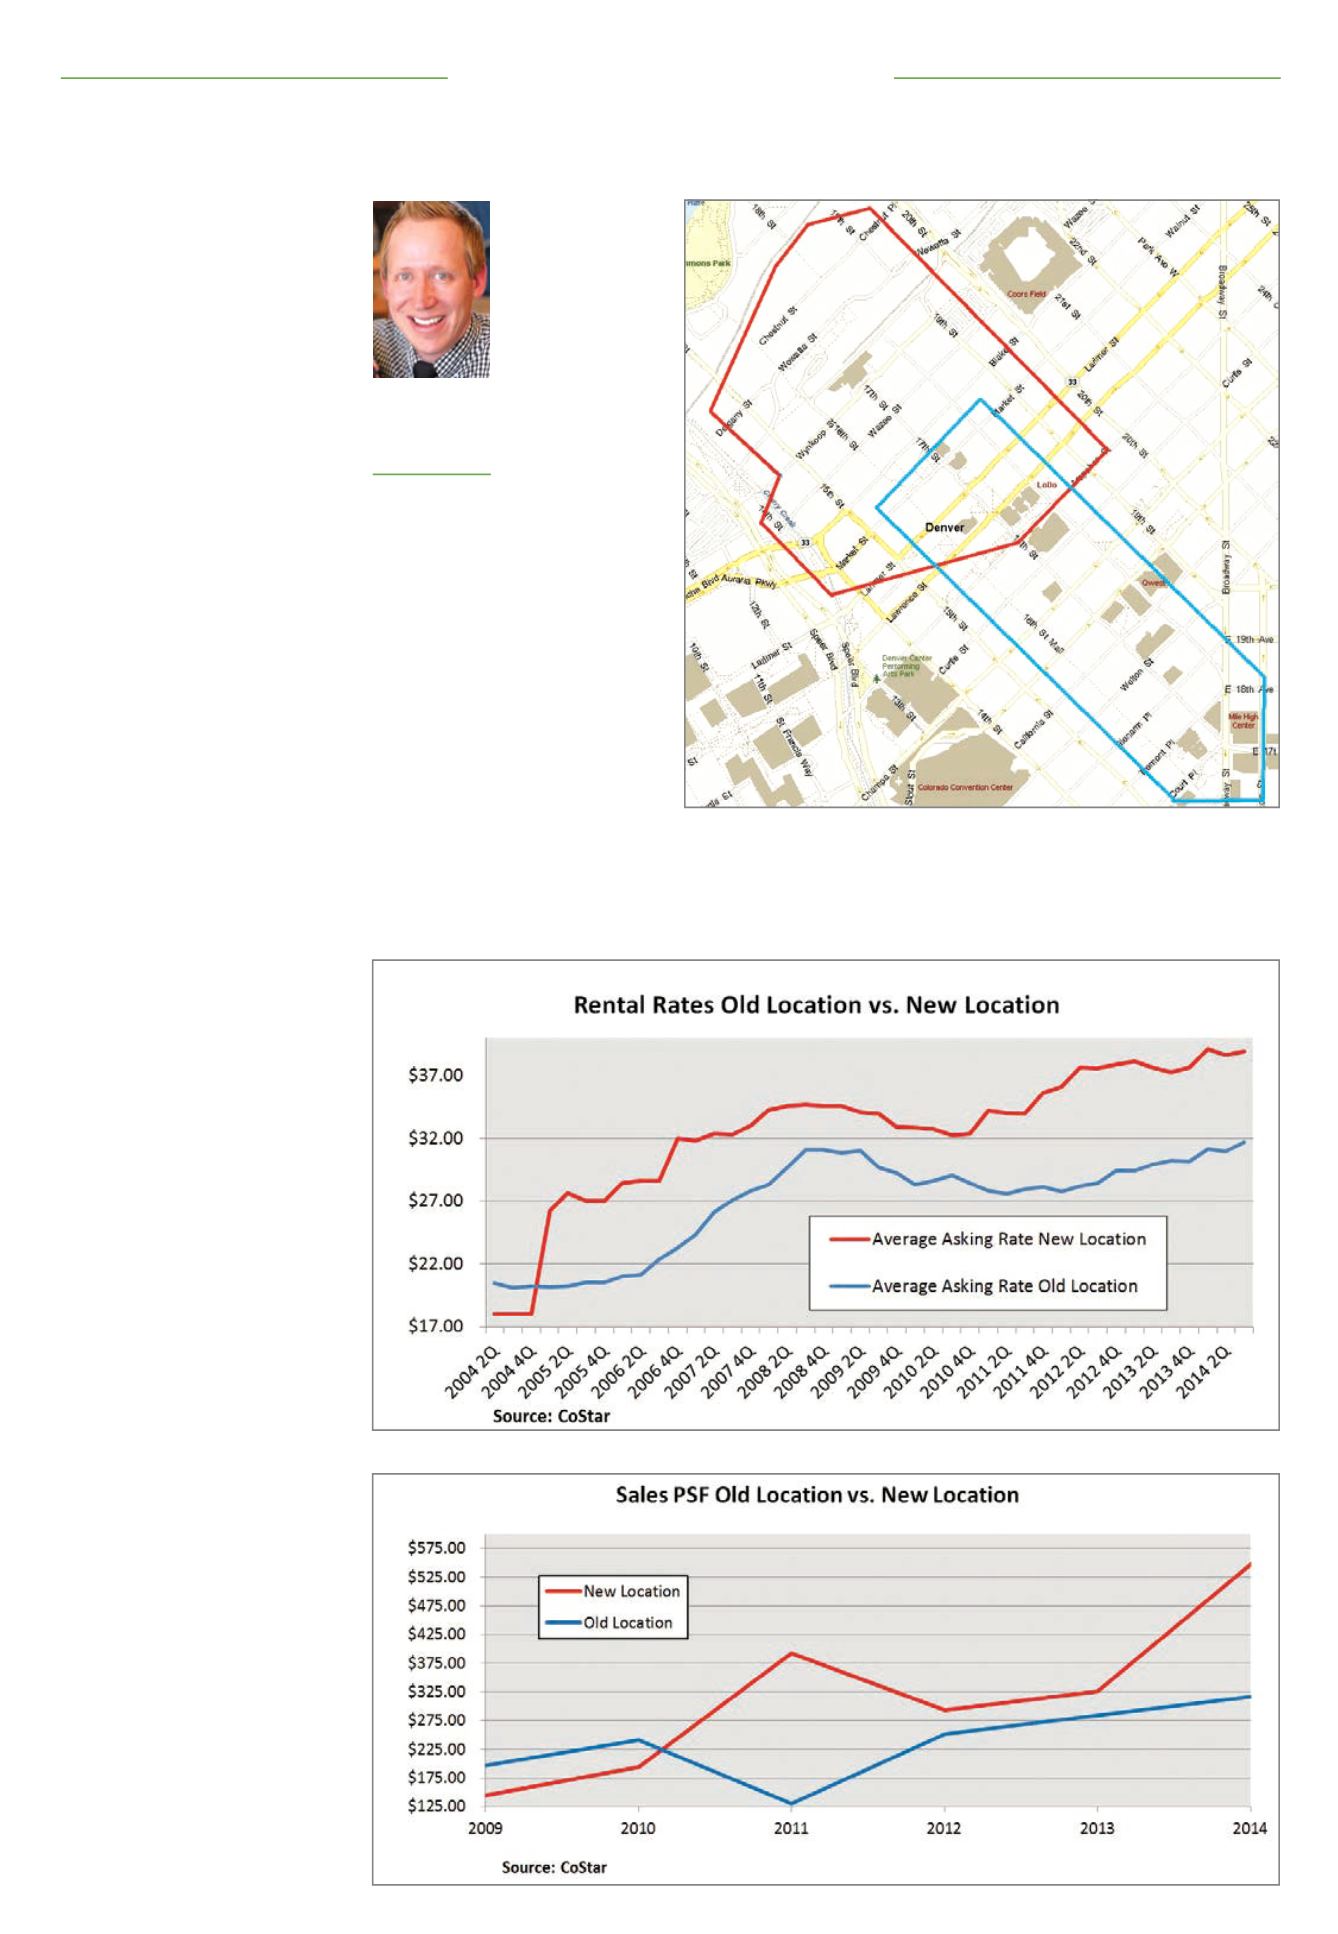
Office Rental Rates
To illustrate how the 100 percent
location movement accelerated over
the last 10 years, the top chart shows
the asking rental rates of the old
versus new locations, according to
CoStar. This timeframe represents the
point near the bottoming out of the
market in the early 2000s, the run up
through 2008, then the drop during
the most recent recession, to the cur-
rent time period. What is important
to note is the overlapping of rates in
the early 2000s with the old location
reporting higher rental rates than the
new location.
However, this quickly changed as
the spread between the two locations
grew dramatically in 2004. Accord-
ing to data collected by CoStar, the
10-year annual rental rate increases
for the new 100 percent location was
6.9 percent in contrast to the old loca-
tion at 5.2 percent annually. Further,
current asking rates were reported to
be $38.20 and $31.37 per square foot,
respectively. This
spread is continu-
ing to increase as
inventory is added
to the new 100
percent location
and investors and
tenants continue to
select this location.
Office Sales
Significant capi-
tal is invested in
both of these areas.
Office transactions
completed in 2013
(17 office property sales) and 2014 (14
office property sales) again support
the shift of the 100 percent location.
Most significantly, in early 2014, the
Denver Union Station wing buildings
sold to a Munich-based investor for a
price of approximately $600 per sf, a
record-setting amount for the Denver
CBD. In contrast, sales that transacted
in the old 100 percent location saw
prices in the high $200s to low $300s
per sf for the same time period, which
is well below the reporting of the wing
building sales.
The bottom chart shows price per
sf for each location over the last five
years as reported by CoStar. This
information supports our findings.
As demand for new office space
continues in the Denver CBD, and ten-
ants and investors wish to be located
in new, transportation-based develop-
ments in the urban core should con-
tinue to see growth. This rising tide
should lift the overall downtown mar-
ket and continue to attract new and
existing tenants and investors.
s
Hot spots shift west in central downtownJustin J. Atwell,
MRICS
Director, Integra
Realty Resources,
Denver
The red line represents the new 100 percent location in downtown Denver. The
blue line represents the old location.
Rental rates at the two locations
Sale prices at the two locations