Page 28
— Multifamily Properties Quarterly — May 2016
Pinnacle Real Estate Advisors
Matthew Ritter • Jeff Johnson
Joe Hornstein • Jules Hochman
Josh Newell • Matt Lewallen
Kevin Calame • Greg Breslau
Cody Stambaugh • Peter Sengelmann
Connor Knutson • Robert Lawson
Jim Knowlton • Scott Fetter • Brent Hubbell
Thomas Graeve • Justin Brockman
Unique Properties Inc.
Marc S. Lippitt • Scott L. Shwayder
Tim Shunta • Jason Koch • Adam Riddle
Kevin Higgins • Ryan Floyd • Alfonso Avila
Mike Hesse, CCIM
Marcus & Millichap
Greg Price • Brian Haggar • Clayton Primm
Eric Schierburg • Jason Steele • Nick Steele
Moran & Company
David Martin • Pamela Koster
FarrellRes
Frank Farrell
FarrellRes
J & B Realty
Steve Peckar • Matt Landes
Peter Kapurnais • Garth Gibbons
JLL
Pat Stucker • Ray White • Travis Hodge
Cushman & Wakefield
Pat Henry
Interurban Corporation
William T. Doogan
ARA – A Newmark Company
Jeff Hawks • Doug Andrews • Terrance Hunt
Shane Ozment • Chris Cowan • Steve O’Dell
Justin Hunt • Andy Hellman • Saul Levy
Kevin McKenna • Jessica Graham
Spencer Bradley • Robert Bratley
Anna Stevens • Amanda Meldrum
Julie Rhoades • Kevin Jewett
Colorado Group, Inc.
Miles King • Scott Crabtree
Jessica Cashmore • Todd Walsh
CBRE
Dave Potarf • Dan Woodward
Matthew Barnett • Jake Young
Colliers International
Craig Stack • Bill Morkes
Berkadia
Winston Black • John Laratta
MULTIFAMILY BROKER DIRECTORY
For contact information, firm profiles and links, please visit
click on Industry Directory, then Brokers, then Multifamily subcategory
Multifamily Broker Directory
@
W
e’re all aware of what
seems to be a building
frenzy in the apartment
sector in Denver, accom-
panied, until recently, by
strong rent growth. According to
the latest report from apartment
data provider Axiometrics, “Denver
had a similar (to San Francisco)
end to 2015, finishing with its low-
est year-to-date rent growth of the
recovery – though 5.6 percent was
fairly robust,” it said. “Things were
looking the same through the first
two months of 2016, with negative
YTD rent growth in January, though
a strong March rebound moved it
out of the post-recession basement.”
And here are some nuggets from
the quarter-one market perfor-
mance summary on the Denver,
Aurora and Lakewood metropolitan
statistical area:
• The market’s annual rent growth
rate was above the national average
of 4.1 percent.
• The market’s occupancy rate
decreased from 94.7 percent in
fourth-quarter 2015 to 94.5 percent
in first-quarter 2016.
• As of April 10, Axiometrics iden-
tified 9,056 apartment units sched-
uled for delivery in 2016, of which,
1,958 have been delivered. As a
comparison, there were 9,197 apart-
ment units delivered in 2015. Prop-
erties delivered to the market in the
last 12 months achieved an average
asking rent of $1,816 per unit. Effec-
tive rent has averaged $1,753.
So there is a snapshot of the
recent past, which seems to indi-
cate continued construction in the
face of only mildly
softening (by grow-
ing more slowly)
building perfor-
mance. But what
do the long-term
trends look like?
Historical
Perspective
By long term I’m
not talking about
the 1980s, but rath-
er everything built
since the Great
Depression. How
did Denver grow and what were the
trends into and out of and back into
the urban core, Englewood or Lower
Downtown?
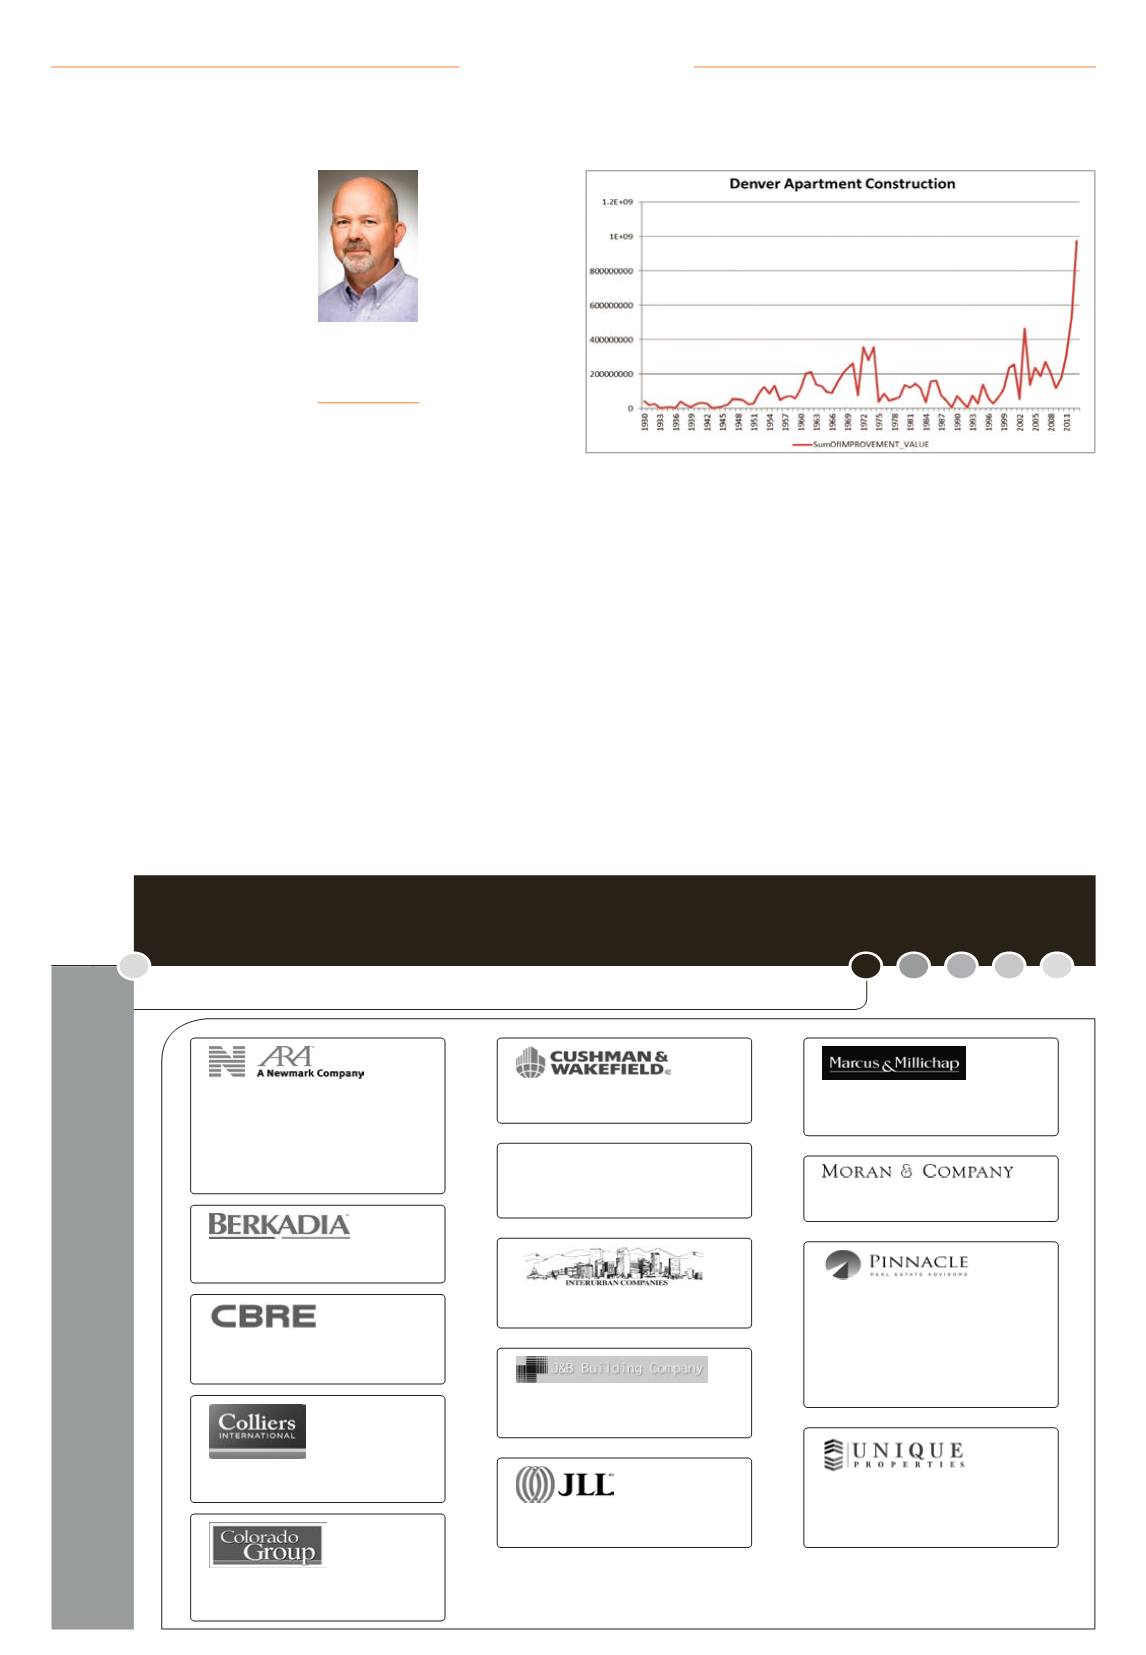
All markets go through construc-
tion cycles, and we only think this
one is particularly noteworthy
because we are in it. The chart
seems to bear this out; however,
there is a very noticeable uptick
when you look at what has hap-
pened since 2011.
The vertical axis in this case is
the total current appraised value
of the properties originally built
in each year and comes from the
Denver Assessor’s Office, which
lacks much detail for recent years,
but the report from Axiometrics
suggests this upward trend contin-
ued through the peak of deliveries,
which was just last year (in units).
In the 1930s, 1940s and 1950s,
multifamily construction activity
in Denver was fairly widespread.
Of course, this is a 30-year period,
but there were several pockets of
concentration as opposed to one
dominant area – the latter of which
is common in many metro areas in
this time frame.
The ’60s follow a similar pattern
with a little less dispersion and
more concentration downtown and
south, but the ’70s, ’80s and ’90s
show fairly dispersed activity with
no one highly favored area of con-
centration.
This changes in the early 2000s,
when a building boom begins to
take a foothold in the LoDo area,
with other areas of concentration
south of downtown. This 2000 to
2009 period represents 91 apart-
ment buildings over $3 million in
current appraised value, includ-
ing mixed-use. In the 1990s, that
number was only 24. This trend has
become even more pronounced in
the years since 2010. You can view
a video of the entire progression by
decade on our website, where there
also is a video showing this same
information annually for 2000 –
2015.
Returning to long-term trends –
there’s no question we are building
a historically unseen level of apart-
ments and at volumes multiples
beyond previous periods. Rents
seem to be softening some, but will
continue to be driven by supportive
demographics and job growth. That
being said, job growth is cyclical and
highly correlated to rent growth.
Mark Daniel
Vice president,
partner relations,
RealMassive,
Austin
Final Thoughts
Graphic courtesy RealMassive
While all markets go through construction cycles, the current cycle is producing at
historic rates.


